A system to match supply automatically with demand, to optimise warehousing efficiency.
Our client manages the importation and distribution of hundreds of products in several markets in Australia and New Zealand, with varying constraints such as lead times, seasonal demand, regional market conditions, and product substitution.
This is a client/server system running on Microsoft Windows and .NET. The server is hosted internally by our customer in Sydney, and the clients deployed in Australia and New Zealand.
The system is built upon our Escape Velocity software platform. This provides secure client/server communications via HTTP over TCP/IP, encrypted with TLS using 256-bit ephemeral elliptic curve cryptography. Clients can work independently on the same data, protected by robust conflict-resolution protocols. Server software includes an optimized HTTP server, a business rules engine, and client access controls. It is backed by a Microsoft Access database, with automatic migration paths to Microsoft SQL Server and MySQL.
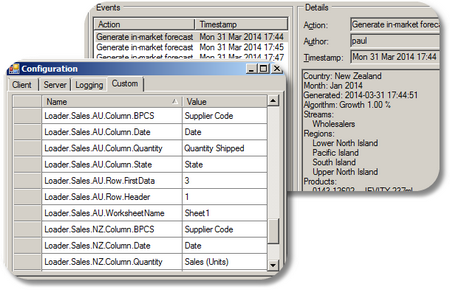
For reduced maintenance, all interfaces to external systems are fully user-configurable. Data from external sources, such as sales results, shipping schedules and inventory reports, are loaded into the system from Excel files. The formats of these files are defined by per-user configurations, easily accessible from the client application’s menu.
The system maintains an audit log of all data updates, so the demand manager can track the source of all figures.
The client software is installed as an isolated application. This allows the users to install upgrades without needing administrator privileges, and without needing direct help from their IT folks.
Every month our client forecasts sales of every product in each month for the next two years. The forecasts are based primarily on historical sales patterns and planned marketing activities.
The people involved in the process are the demand manager, the supply manager, and a team of product managers. The demand manager has overall responsibility for the entire process, and for the accuracy of the forecasts. The product managers are responsible for individual products in various markets, and in the context of this system their role is to produce sales forecasts for their products. The supply manager is responsible for ensuring that supply matches demand, without shortfall or excessive over-stocking.
At the start of each month the demand manager loads the latest sales report, inventory list and shipping schedule into the system. Then he clicks a button to prepare a new blank forecast. This blank forecast contains all products, along with their sales histories. The demand manager then notifies the product managers that the new forecast is ready for them. This all takes about ten minutes.
Next the product managers prepare their individual product forecasts. For each product the manager selects an appropriate statistical forecast algorithm from a library of pre-defined algorithms. For example, for one product she might choose a 3-month run rate, and for another she might forecast a 5% growth rate. It takes the system about ten minutes to generate forecasts for all products. Then the product manager reviews the figures, and optionally overrides individual monthly figures if she anticipates a variation from the statistical forecast.
Sometimes a product manager wants to apply a custom forecast algorithm to a particular product. To do this she exports the blank forecast to Excel, does her custom forecasting there, and then imports the result back into the system. This way the system usually does the heavy lifting of the bulk forecasting, but the manager always has the flexibility to do things differently if she wants to.
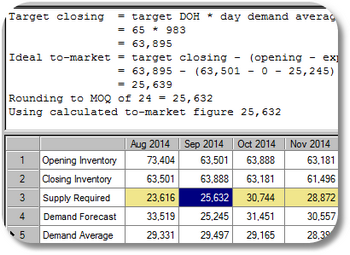
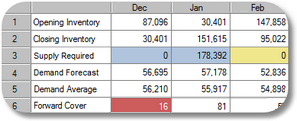
When all the product managers have completed their forecasting, the supply manager gets to work. He opens the forecast and clicks a button to run the supply algorithm, which calculates monthly ordering quantities. For each product, in each month, the algorithm takes into account the opening inventory, the product managers’ sales forecasts, historical demand patterns, the shipping schedule, and other factors, and calculates the optimal order quantity. This takes about twenty minutes.
The system highlights any numbers that fall outside configured tolerances, such as inventory insufficient to satisfy forecast demand. This can happen when demand depletes stock within a product’s lead time window and can’t be replaced, or when the supply manager manually overrides a system-generated figure.
At every step in the process the system records details of how all figures were calculated, so that everyone can see where the numbers came from. And all system-generated numbers can be overridden manually.
Finally, when the supply manager has produced the optimal order quantities, the demand manager exports the order data to a file, and loads the file into their ordering system.
Our client's old Excel system was at — or beyond — its limits of complexity. This constrained the business, making it very difficult to introduce new business processes.
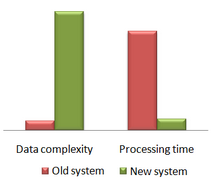
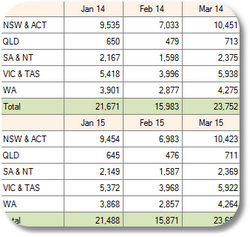
For example, they were forecasting sales at a national level, aggregated across all markets. They wanted to start forecasting individually by state and by market, but this would increase the data volume by a factor of twenty-five. They also wanted to forecast by both gross and net price, where these varied independently by state, market and month. Even if our client had been able to handle this increased complexity in their already over-complex Excel spreadsheets, the extra processing would have exceeded the available time window.
We gave our client a new system that takes all of this complexity in its stride, and it does it all in a few hours rather than days. The shortened processing time allows our client to do their monthly forecasting a few days later, thereby taking advantage of more up-to-date market data.
With the tedious, routine parts of the business process automated, the demand manager, the supply manager, and the product managers can now approach their tasks with clearer heads. This reduces the risk of error due to fatigue, and frees them up to think at a more strategic business level — thinking about what the numbers mean and how to improve them, rather than the details of how to produce them.